[ SWIFT ] - 在Xcode中如何debug!!,Xcode Debugging Print Statements, Breakpoints, and LLDB
前言
最近開始在UDACITY聽一些Swift的課程,其中這堂Xcode Debigging 課程深深吸引了我!因為每當努力開發 app時,總是會對天書般的錯誤訊息給難倒!只能求助Google大師,而這堂課則是詳詳細細的介紹了Xcode中的幾種debug方式,現在就讓我來為大家簡略介紹一下吧!!如果可以當然也希望各位可以親自欣賞影片!
課程名稱:Xcode Debugging Print Statements, Breakpoints, and LLDB
課程影片:https://www.udacity.com/course/xcode-debugging--ud774課程內容:

Debugging Lingo-如何描繪你的Debug
When solving (and sharing) bugs, it is important to know the right lingo! Being able to describe your bug precisely is key (especially when talking to developers)!在解決問題時,最種要的是了解如何描述你的問題,常見的幾種問題如下:
- logic error: a bug in a program that causes it to operate incorrectly, but not to terminate abnormally (or crash)
- runtime errors: issues that occur while your application is running—these can be logic errors or errors that cause your application to crash
- software bug: an error, flaw, failure, or fault in a computer program or system that causes it to produce an incorrect or unexpected result, or to behave in unintended ways
- static errors: issues identified by the compiler that must be fixed prior to running your application
- warning: issues that might cause problems or have unintended side-effects on your running application
The Debugging Process - Debug的流程
在debug的過程中,當app開發工程師在獲得bug資訊後,會面臨幾種xcode回覆得異常情況,而工程師透過bug資訊來了解bug得種類,是變量造成的異常或是錯誤程式碼所在位置等...

Lesson 1A: Debugging, Printing, Logging-本課程將介紹debug的流程與透過 Printing 與 Logging找出你的 bug
In this lesson, you'll be introduced to the "So Many Bugs" app, which we'll use to solve coding mysteries throughout the course. You'll also learn about the debugging process, and how to use print statements to identify bugs.
Lesson 1B: Stepping Through Code
In this lesson, you'll learn how to use breakpoints to examine application state at any point during execution.
Printable and DebugPrintable
說明:在初期debug的過程中,常會藉由println,來留下許多app執行過程中的訊息,以利app工程師能找出錯誤原因(例如:是否為傳值錯誤或是傳值時的形態錯誤等)
(1)app工程師必須先猜測異常的發生點,然後再猜測的發生點前後設置println
(2)大量設置的 println不好維護
改善方法:透過Printable留下記錄(達到類似Log記錄功能)


課程過程中都會有類似下面這樣的問題,有些是問答題喔!個人覺得算是非常用心得線上教材 

再次重申使用 Println debug的缺點:不好維護
建議使用:Printable

除了透過Printable留下Log之外,另一個更方便的方法是:使用BreakPoint設置中斷點


6個表示不同變數的圖示
 補充介紹:BreakPoint 的種類
BreakPoint 的種類依照使用方式大致上可分為:
(1)Normal Breakpoint:一般中斷點
(2)Exception Breakpoint:異常中斷點
(3)Symbolic Breakpoint:符號中斷點
(4)OpenGL ES Error breakpoint:動畫或影片中斷點
(5)Test Failure Breakpoint:暫停程序中斷點
(6)WatchPoints:查看中斷點內容
※紫色部分都是透過Xcode下方 Create a BreakPoint來新增。

(1)Normal Breakpoint:一般中斷點
最常用也是最簡單的BreakPoint,設定方式:直接在UI左側行數上點選即可設定,另外也可以透過lldb指令來新增BreakPoint:
(1.1)查詢:通過 br li指令查詢所有的breakpoint。(1.2)新增:breakpoint set -f XXX.m -l XX 和 b XXX.m:XX。

(2)Exception Breakpoint:異常中斷點
當app異常時產生中斷點,讓程式可以停留在異常的地方,但不是所有的異常情況都可以使用,例如:陣列異位,便無法使用此中斷點,其中Exception可以設定例外的情況


你可以在Xcode的GUI中設置watchpoint,在xcode的 Variables View中,把你想觀察的變量保留出來,然後右鍵設置「Watch XXX」。


(3)Symbolic Breakpoint:符號中斷點
指定app在執行過程中遇到特定的方法或物件名稱時中斷,Symbol的內容,有以下幾種:
1. 方法名稱:會對所有具有此方法名稱的類方法生效。例如 initWithFrame: 。
2. 特定類的方法:OC類和C++類都適用,例如 ,[UIView initWithFrame:]或者 Shap::draw()。
1. 方法名稱:會對所有具有此方法名稱的類方法生效。例如 initWithFrame: 。
2. 特定類的方法:OC類和C++類都適用,例如 ,[UIView initWithFrame:]或者 Shap::draw()。
3. 函數名稱。例如普通C函數。

(4)OpenGL ES Error breakpoint:動畫或影片中斷點
很抱歉!目前我還沒有這方面的經驗,因此提供一些網路上找到的資訊

(5)Test Failure Breakpoint
在test assertion 失敗的時候暫停程序的執行。
(6)WatchPoints:查看中斷點內容
這是一個用來監聽變量的值的變化或者內存地址的變化的工具,發生變化時會在debugger中觸發一個暫停。對於那些不知道如何準確跟蹤的狀態問題,可以利用這個工具來解決。要設置watchpoint的話,在程序運行到stack frame包含有你想觀察的變量時,讓debugger暫停運行,這個時候變量在當前stack frame的scope內,這個時候才能對該變量設置watchpoint。你可以在Xcode的GUI中設置watchpoint,在xcode的 Variables View中,把你想觀察的變量保留出來,然後右鍵設置「Watch XXX」。

Lesson 2A: LLDB and Breakpoint Actions -透過 LLDB找出 bug
In this lesson, you'll learn about LLDB (low-level debugger)—the debugging super tool. You'll be introduced to common LLDB commands, tips, and tricks.
//Fixing Settings Bug with Breakpoints
//Stack Traces for Creating a Bug
//Variable Kinds-icon kinds

LLDB Reference Material
LLDB can seem scary at first, but it just takes practice. Apple's LLDB Quick Start Guide is a great reference if you want to dig deeper with LLDB.Also, if you are referencing other materials online, pay close attention to the language: LLDB's support is different for Objective-C and Swift. Of course, the best way ensure an LLDB command is supported is by testing it yourself!
第一次看到LLDB或許覺得很恐怖,很難,但其實你只是需要練習。蘋果LLDB快速入門指南是一個很好的參考,如果你想更深入的了解LLDB。
另外,如果你是在網上參考其他資料,請注意:LLDB對Objective-C和Swift 支援的內容不同。當然,最好的確認辦法就是自己測試吧!
在設定中斷點之後,可以在右下方中看到lldb的區塊,以下將針對lldb的應用進行介紹:
(1)查詢所有lldb指令:輸入help

(2)常用指令:
LLDB命令的語法有其通用結構,通常是以下形式的:
其中:
(命令)和(子命令):LLDB呼叫命令的名稱。命令和子命令按層級結構來排列:一個命令對象為跟隨其的子命令對象創建一個上下文,子命令又為其子命令創建一個上下文,依此類推。
(2.1) po(print object)是LLDB的一个命令,其主要功能是输出objective-c中对象(objects)的信息,与之相似的另外一个命令是 p(print),其主要功能是输出原生类型(boolean、integer、float、etc)的信息。
範例:
po [self view] 或 p (int)[[[self view] subviews] count]
(2.2)透過expr修改變數的值
以往要測試是不是因為變量的值導致app異常時,總是要在程式中先指定變量值後再執行app,驗證是否異常,而現在只需要在設定中斷點之後,於lldb 中輸入expr 變量名稱=設定值,即可。
範例: expr bugs=100
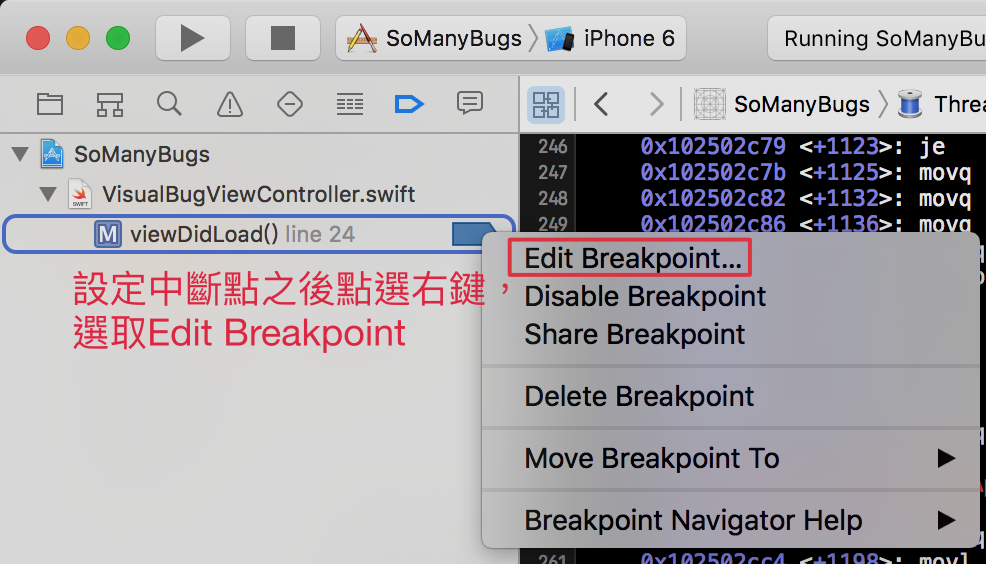
(2.3)透過Edit Breakpoint 修改變量的值
除了在lldb中輸入指令外,也可以透過Edit Breakpoint的方式設定變量值 ,設定方式如下:


除了預設的Debugger Command模式外,還有其他模式

(2.4)透過Condition設定中斷點的觸發條件
中斷點必須在符合Condition的情況下才會中斷,例如:Bugs.count >3

(2.5)格式化輸出內容
透過alloc來指定輸入的格式,範例:po [[NSString alloc] initWithFormat:@"Item index is: %d", index]
Lesson 2B: Breakpoints and Visual Tools-透過Breakpoints與虛擬工具找出bug
In this lesson, you'll learn about exception and symbolic breakpoints, and how to debug your code using Xcode's visual debugging tools.
//
Quick Look- Debug View Hierarchy
透過View階層找出問題,設定中斷點之後點選View Hierarchy按鈕

設定階層之間的間距


呈現View的contraints

秀出franes或內容


留言
張貼留言
您好:
歡迎到訪我的Blog,這裡有我的生活經驗、美好的回憶和程式開發經驗分享~
目前努力學習Swift中,希望你會喜歡Swift!
如果可以也請你留言給我一個鼓勵喔!
謝謝